Population distribution
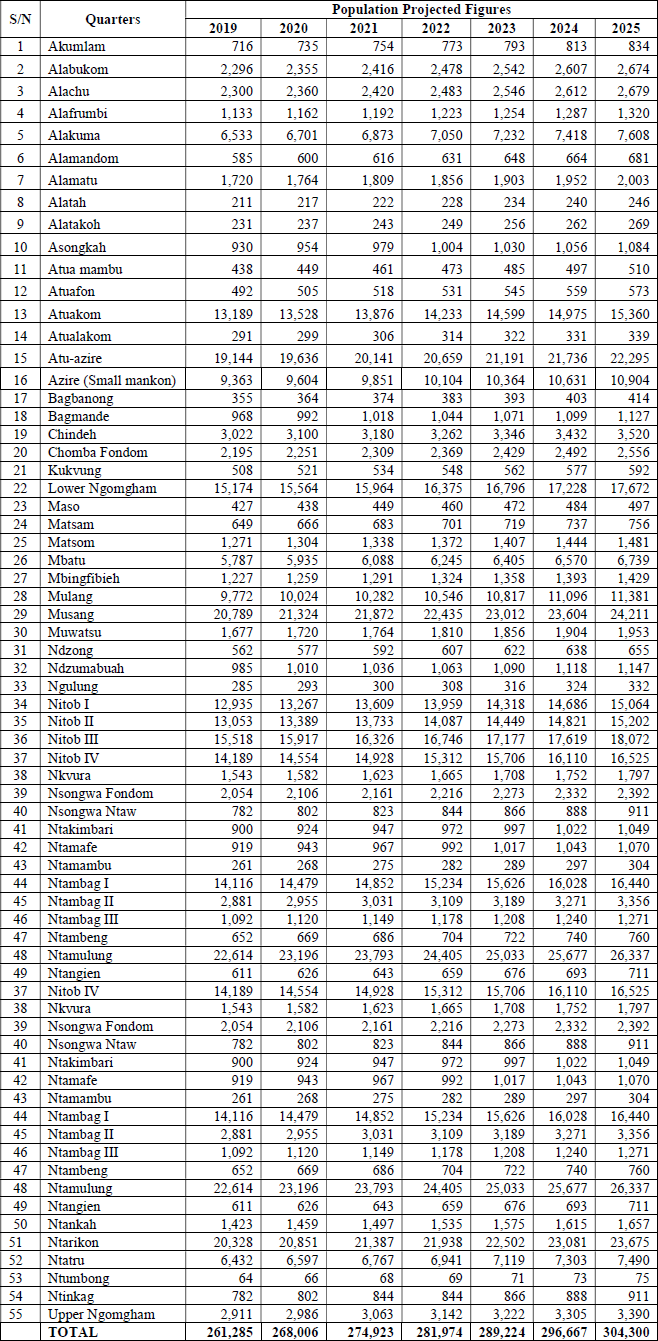
According to the 2005 census, the population of Bamenda II Council was 201,764 inhabitants. With an average annual growth rate of 2.54% from 2005 and 2019, the population of Bamenda II Council by 2019 is projected to be 261,285. It is important to note that new quarters have been created; firstly, by splitting some of the old ones and secondly, the creation of new settlements at the peripheries of the town due to urban expansion. The population figures of the new quarters are either incorporated into the old ones or the figures do not exist. The Mankon Fondom took up the initiative for all its Quarter Council to carry out a census. Its results are still awaited. Table 3.2 shows the population evolution from 1976 to 2019.
Population figures/evolution Bamenda II Council (1976 to 2019)
| RGPH Year | Population | Growth rate (%) |
| 1976 | 48,111 | / |
| 1987 | 110,142 | 7,8% |
| 2005 | 201,764 | 4,9% |
| 2019 | 261,285 | 2,5% |
Source: 3rd GPHC BUCREP 2005; Projection by CARD 2019
Population Distibution and Projection - Bamenda II Council
The population projection of the quarters within the Bamenda II Council according to age groups is as seen below. Population projection method adopted:
b - exponential projection: Pn = Pi ern
Where
Pi: designates population of initial year, = P2005
Pn: designates population of year n (range of projection), = P2019
r: designates average annual population growth,= 0.0254 (2.54%)
n: designates the exact number of years between i and n .
e 2.718281828
Projection Population figures of Bamenda II Council