Activities and occupations of heads:
The survey permitted the identification of two types dominant activities:
- The public and semi-public sector that occupies 32% of the heads of household;
- The commercial or business sector occupying 25.64% of the heads of household.
The percentage of workers in public service is lower (28.85%), indicating that Bamenda, in the nearest future, won't be any more civil servant dominated but business dominated.
The second activity that occupies the residents is unfortunately agriculture (35.90%) instead of industry. Indeed, the agricultural activity is part of the primary sector that only develops itself in the peripheries of the town, whereas the industrial activity which is needed to permit the development of the industrial zones and create more jobs is virtually absent. What is observed are repair shops mainly automobile, limited to the purchases and replacements of imported used motor vehicles spare parts found within the Fon Street area.
Population by Age Groups:
Based on the projected 2019 population figures, of BIIC of 261,285 inhabitants, the population structure by main groups and by age is as follows:
- Population less than 15 years: 43.53%;
- Population less than 15-19years: 12.91%;
- Population from 19-60 years: 39.76%.
- Population 60 years and above: 3.80%.
Based on these statistics, it can be deduced:
- The scolarisable population of BIIC is: 261,285 x 54.44% = 142,243 inhabitants
- The ability of the population to work is: 261,285 x 39.76% = 103,886 inhabitants
- The theoretically inactive population is: 261,285 x 3.80% = 9,928 inhabitants.
Structure of Incomes and Expenditure of Household Heads
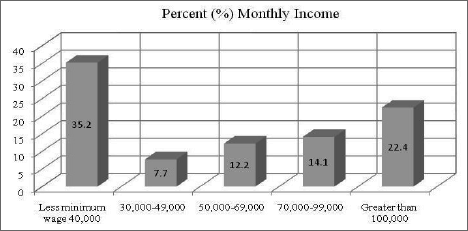
A) Level of Incomes: It was not easy to have some answers on the incomes of the heads of household. The monthly average income from the results is relatively low. A simplified distribution of the results presents itself as follows:
- 35.2% earned lower than the guaranteed minimum wage of 40,000FCFA
- 7.7% of household heads earned between the guaranteed minimum wage and 50,000 FCFA
- 12.2% of household heads earned between 50,000 and 69,000 FCFA
- 14.1% of household heads earned between 70,000 and 99,000 FCFA
- 22.4% of household heads earned greater than 100,000 FCFA.
B) Educational level of heads of households: On the other hand, the different results enabled the establishment of interrelationship between the level of income and the level of educational attainment i.e. (30.1%) of the heads of household completed only primary school, hence, corresponding to the low monthly income of these heads of households, which showed that because of the low level of education of the heads of households, their income falls within the first group (lower than 40,000FCFA) as monthly income representing 35.2%.
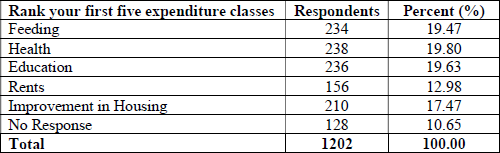
C) Main Expenditure of household: As seen in the table, the primary preoccupation of the inhabitants is firstly health (19.80%), followed by food (19.47%), then rents. This is an indicator of the vulnerability of the population on the income plan. Besides, it equally revealed that a good number of residents have some form of incomes which guaranteed minimum wage.